Capture
Capture .jfr files using standard JDK tools, JVM startup flags, or let the yCrash agent automatically trigger recordings during performance problems.
Deterministic JFR analysis combined with conversational AI intelligence to help you find and resolve complex JVM performance problems faster.

How It Works

How It Works
JDK Flight Recorder captures incredibly rich JVM data. JDK Mission Control (JMC) provides powerful visibility into that data, but engineers still need to manually navigate events, correlate symptoms, and determine the root cause.
yCrash JFRPlayer goes beyond traditional JFR analysis. Its deterministic analysis engine automatically detects CPU bottlenecks, memory leaks, GC problems, thread contention, and other JVM performance anomalies. JVM-aware AI then explains why the problem happened and recommends what you should do next.
Unlike JMC, you can analyze JFR files directly from your browser, automate analysis using a REST API, archive and compare historical JFR recordings, and securely mask sensitive data. JFRPlayer can also correlate JFR events with GC logs, thread dumps, heap dumps, and system metrics, giving you a complete 360° view of complex production incidents.
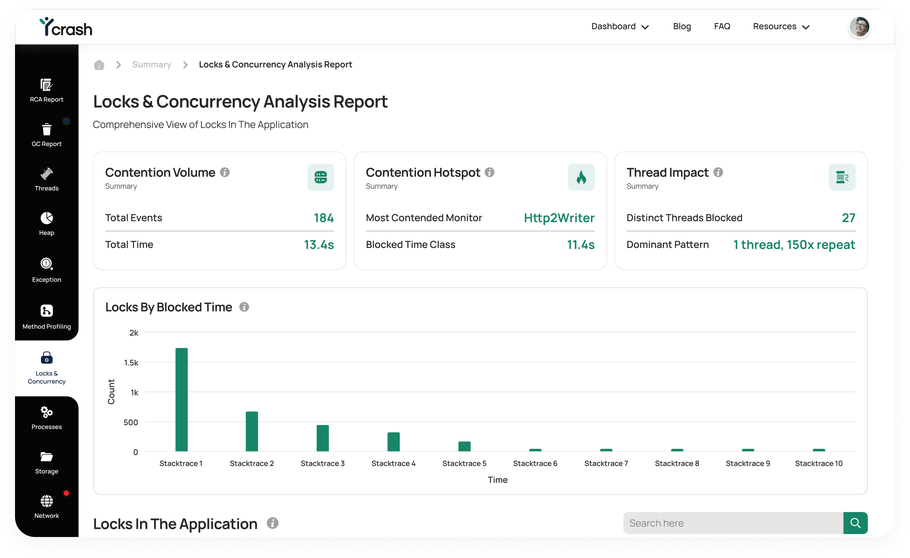
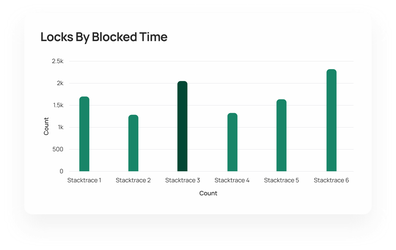
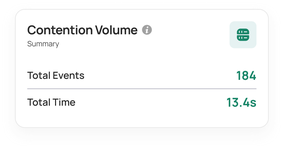
Turn complex Java Flight Recorder data into clear answers. With yCrash JFRPlayer, you can analyze millions of JFR events, identify JVM performance bottlenecks, and understand why CPU, memory, GC, or thread problems occurred. Deterministic analysis and JVM-aware AI help you find the root cause faster and fix problems with confidence.
JFRPlayer deterministically analyzes complex Java Flight Recorder events and transforms them into validated facts. JVM-aware AI then explains why CPU, memory, GC, or thread problems occurred and provides clear, actionable remediation recommendations, without relying on AI to calculate your underlying performance metrics.
Use JFRPlayer as a zero-install online JFR analyzer in the cloud or within your own environment. Simply drag and drop .jfr files for instant analysis without downloading, installing, or configuring heavyweight desktop software.
Keep sensitive JFR diagnostic data secure with SAML/SSO authentication, role-based access controls, data masking, and detailed audit trails. You control who can access production performance data while preventing sensitive diagnostic files from being scattered across desktops, email, or collaboration tools.
Stop analyzing JFR files one at a time. Use JFRPlayer's REST API to programmatically analyze recordings across hundreds of JVMs and integrate JFR analysis directly into your CI/CD pipelines, performance tests, monitoring systems, and automated workflows.
JFRPlayer centrally archives your historical JFR analysis reports. Search by application, host, release, tags, or date, and compare JFR recordings side-by-side to identify exactly what changed between releases, environments, or performance tests.
Don't troubleshoot JFR data in isolation. JFRPlayer can correlate JFR events with GC logs, thread dumps, heap dumps, and system metrics, giving you a complete view of the incident and helping you identify root causes that a JFR recording alone may not reveal.
When CPU spikes, memory leaks, OutOfMemoryErrors, long GC pauses, or latency problems hit your JVM, you need answers quickly. Upload your Java Flight Recorder (.jfr) file and JFRPlayer analyzes millions of runtime events to identify the methods, threads, and JVM behavior responsible for the problem.
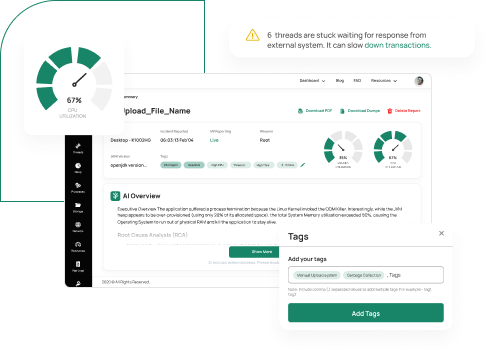
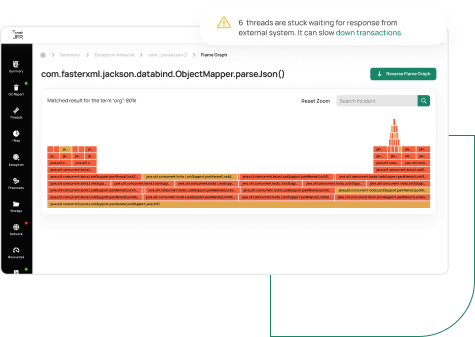
Turn millions of complex JFR events into visual insights you can understand quickly. JFRPlayer presents CPU and memory flame graphs, deep call trees, GC pause timelines, allocation analysis, and thread contention views so you can trace performance problems directly to the code causing them.
Don't miss the evidence when a production problem occurs. The yCrash agent can automatically trigger JFR recordings when CPU, memory, or latency crosses configured thresholds, capturing critical JVM activity while the issue is actually happening and making post-incident analysis far more effective
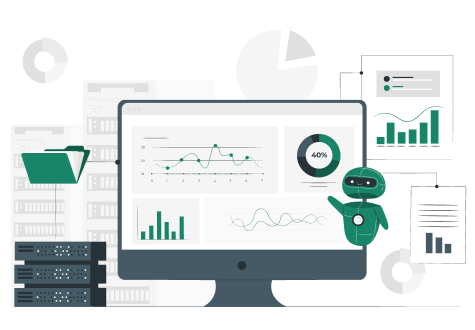
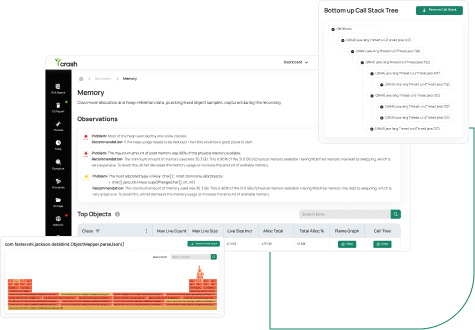
When your JVM crashes or runs out of memory, understanding what happened immediately before the failure is critical. JFRPlayer analyzes pre-crash Java Flight Recorder events to identify abnormal allocations, CPU activity, GC behavior, threads, and code execution patterns leading up to the incident.
Compare to understand their key features, capabilities, and use cases for Java Flight Recorder analysis.



1
Capture .jfr files using standard JDK tools, JVM startup flags, or let the yCrash agent automatically trigger recordings during performance problems.

2
Drag and drop your JFR file into JFRPlayer. The deterministic engine instantly analyzes CPU, memory, GC, locks, and thread activity.
3
Identify JVM bottlenecks instantly. Ask JVM-aware AI questions and get clear root-cause explanations with actionable remediation recommendations.
You can capture .jfr recordings using standard JDK tools (jcmd, jfr), startup flags (-XX:StartFlightRecording), or JDK Mission Control (JMC). Here is our article which provides you several different options to capture JFR recordings.
JFR is engineered for continuous production monitoring with minimal overhead (typically under 1–2% CPU). However, overhead can spike if the JVM is already under severe memory or GC pressure, or if high-frequency event sampling is explicitly configured.
Yes. JFRPlayer includes a REST API https://docs.ycrash.io/ycrash-jfr/java-flight-recorder-upload-api.html that allows you to programmatically upload and evaluate JFR recordings across hundreds of JVM instances directly within your CI/CD pipelines, load-testing frameworks, or automated alerting workflows.
Both options are fully supported. The cloud version offers instant analysis with zero setup required, while the on-premise version is recommended if your organization has security, compliance, or data residency policies that restrict diagnostic data from leaving your infrastructure.
Of course. Here are sample JFR analysis reports generated by JFRPlayer:
While JMC is a heavy, desktop-only tool requiring manual event navigation, JFRPlayer is a zero-install web interface featuring enterprise-grade security, SSO, and sensitive data masking. It uses built-in ML and deterministic AI to explain root causes in plain English, provides a REST API for automation, and goes beyond JFR analysis to analyze thread dumps, heap dumps, and GC logs.
We parse JFR event streams across all major JDK distributions and versions. If you encounter an unparseable file format, email your .jfr recording to support@tier1app.com, and our team will enhance the parser right away.
Yes. Beyond JDK Flight Recorder (.jfr) files, JFRPlayer can also parse standalone Garbage Collection (GC) logs, thread dumps, and heap dumps to give you a complete 360° diagnostic report of complex production incidents.
Yes. All underlying metrics, detected anomalies, and root-cause findings are 100% deterministic and remain identical. While the text phrasing may vary slightly, the underlying technical diagnosis never changes.
You are welcome to use the charts, flame graphs, and metrics provided by JFRPlayer in blog posts, incident retrospectives, or company reports by specifying attribution "Generated by yCrash JFRPlayer" at the bottom of the graphics.