

GC Log Analysis Powered by AI

Deterministic Precision with Conversational Intelligence

The world's first hybrid analysis engine that combines 100% accurate deterministic parsing with Conversational LLM intelligence. Instantly detect and solve complex memory issues across Java, .NET (New!), Android, and Node.js.

  • Chat with your GC Logs
  • Zero Hallucinations, 100% Data Accuracy
  • Solve Memory & GC Problems in Seconds
  • Get Expert JVM Recommendations
  • Trusted by 10,000+ Enterprises

How It Works

Upload GC Log File

Tip: Compress GC logs (*.zip, *.gz, *.xz, *.lzma) for fast uploads

Copy & Paste GC Log

Rest API (Introduction video)

See complete documentation here

AI GC Log Analysis (Beta)

    Add files
    Submit

    World's #1 choice for GC analysis

    Finest addition to your DevOps Toolbox!

    Made by the engineers, for the engineers

    Toolbox Image
    We Handle Math, AI Handles Talk

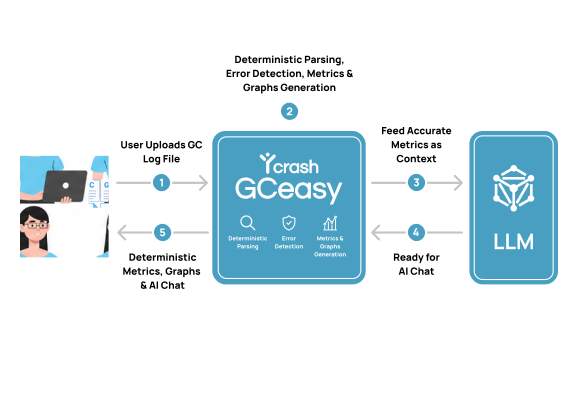
    Standard LLMs often "hallucinate" or skim data when analyzing raw logs directly. GCeasy ensures accuracy by using a deterministic engine to handle the computation before the AI handles the conversation.

    Deterministic Parsing: Our Universal GC Log Parser computes 100% accurate metrics and generates visual graphs first.

    RAG Contextualization: Instead of raw, messy text, we set a precise Retrieval-Augmented Generation (RAG) context in a structured JSON format.

    Grounded Insights: By feeding the LLM only validated metrics, we ensure the AI is "grounded" in facts rather than probability.

    Secure & Hallucination-Free: This workflow eliminates non-deterministic characteristics without compromising the security of your production log files.

    Java GC analysis made easy for developers
    Right GC Algorithm Find Right GC Algorithm For your App

    Guided recommendations help you pick the ideal garbage collector for your heap size and goals, ensuring faster performance with less trial and error.

    Troubleshoot Memory leak Troubleshoot Memory leak, GC pauses instantly

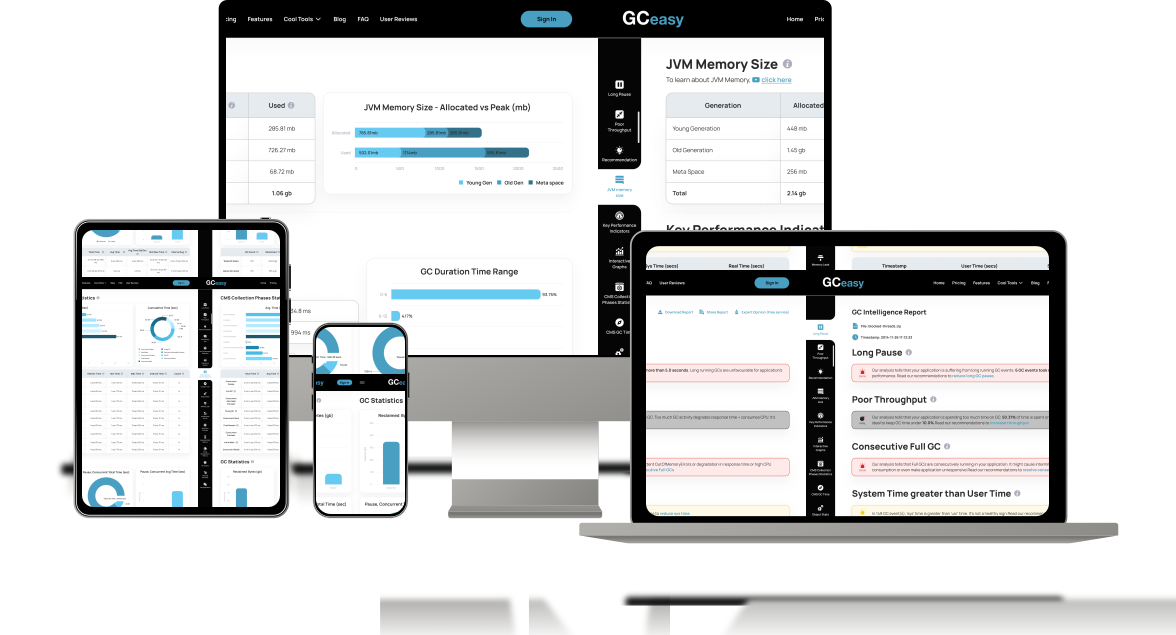
    GCeasy's advanced machine learning algorithm saves time and hassle from dealing with cryptic GC logs. You can quickly detect memory leaks, long GC pauses, premature object promotions plus many other performance impacting problems.

    Toolbox Icon Tune Java GC settings in seconds

    Powerful tool to tune your application's memory and GC settings. Key performance Indicators and GC statistics section of the report, helps you to tune to perfection.

    GC Log Analysis REST API

    In this modern world, Garbage collection logs are still analyzed in a tedious & manual mode. i.e. you have to get hold of Operations engineer, then he will mail you the application's GC logs, then you will upload the logs to GC analysis tool, then you have to apply your intelligence to analyze it.

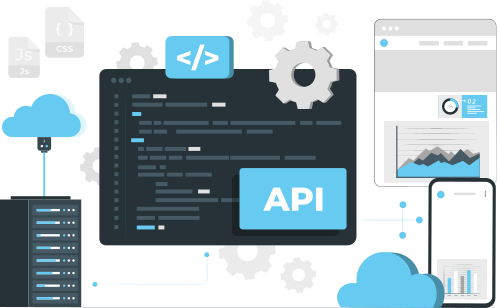
    There is no programmatic way to analyze Garbage Collection logs in a proactive manner. Given this tediousness, it's impossible to analyze hundreds of JVM's GC logs in one stroke. Thus to eliminate this hassle, we have developed RESTful API to analyze garbage collection logs. With one line of code you can get your all your GC logs analyzed instantly. Learn how to use GCeasy REST API.

    REST API for java GC analysis
    One tool to parse all GC formats
    Universal Java GC Viewer

    Based on the GC algorithm, Java version, JVM provider and memory arguments that you pass, GC log format will vary. GCeasy is the industry's first online GC log analyzer which can analyze GC logs of any format.

    • Serial GC, Parallel GC, CMS GC, G1 GC, Z GC, Shenandoah GC, Zing GC, Jstat
    • Java version: 1.2, 1.3, 1.4, 5, 6, 7, 8, 9, 10, 11, 12, 13, 14, 16, 17, 18, 19, 20, 21, 22, 23, 24, 25
    • JVM Provider: Oracle, IBM, HP, Azul, OpenJDK
    • Android GC logs: Dalvik GC Log, Android Runtime (ART) GC Log
    • Supports Unified GC logging format
    • All types memory settings
    • Full Support

    Thus we are proud to be called as Universal JVM Garbage collection log analysis tool

    How it works?

    Java GC Tuning is made to appear as rocket science, but it's a common sense!

    • Enable GC Logs

      You can enable GC log by passing following JVM arguments:
      Until Java 8: -XX:+PrintGCDetails -Xloggc:<GC-log-file-path>
      Java 9 & above: -Xlog:gc*:file=<gc-log-file-path>

    • Upload GC Logs to GCeasy AI

      Upload your logs to our deterministic engine to extract 100% accurate metrics instantly.

    • Chat with GC Logs

      Ask our AI for root cause analysis, heap optimizations, and instant performance solutions.

    Features

    Our cutting-edge features transforms the way how engineers analyze GC Logs

    Deterministic AI Engine Deterministic AI Engine

    Proprietary engine extracts 100% accurate metrics for the LLM to interpret. This ensures conversational insights based on ground truth, not hallucinations.

    Conversational Troubleshooting Conversational Troubleshooting

    Stop deciphering cryptic graphs. Chat with your logs to get instant answers to questions like "Why did my pause time spike?" or "What's the best heap size?"

    AI-Powered Root Cause Analysis (RCA) AI-Powered Root Cause Analysis (RCA)

    Go beyond detection to resolution. Our AI synthesizes complex data to pinpoint the exact root cause of memory leaks and latency issues instantly.

    .NET GC Log Analysis .NET GC Log Analysis (New!)

    Bringing AI-powered precision to the .NET ecosystem. Analyze Managed Heaps, LOH fragmentation, and generational collection issues starting April 14th.

    Node.js GC Log Analysis Node.js GC Log Analysis

    Comprehensive analysis for modern JavaScript stacks. Gain deeper insights into Node.js garbage collection behavior to optimize application throughput.

    Android GC Logs Android GC Logs

    Full support for all Android formats, including Dalvik and ART. Perfect for eliminating mobile stutters and optimizing device battery consumption.

    Java NMT (Native Memory Tracking) Java NMT (Native Memory Tracking)

    Go beyond the heap. Parse NMT output to isolate leaks in Native Memory Regions like Metaspace, Code Cache, and Direct Buffers.

    JStat Analysis JStat Analysis

    The ultimate JVM utility. Analyze JStat output alongside full logs for a quick, real-time health check of your JVM's memory performance.

    Online GC Analyzer Online GC Analyzer

    Zero friction. No registration or installation required-simply upload your log and move from raw data to AI insights in under 10 seconds.

    GC log analysis tool with abundant features

    Learn JVM Performance and Troubleshooting

    Watch A Preview

    Placeholder Image
    TRAINING COURSE

    Learn JVM Performance and Troubleshooting

    • Become a world class JVM performance expert
    • Troubleshoot production performance problems in a fraction of time

    Instructor: Ram Lakshmanan, Architect of GCeasy

    What's included:
    • 9 hours of video series with case studies and real life examples

    • 3 months yCrash tool subscription

    • e-books and study material to complete this course

    • LinkedIn shareable certificate

    • 1 year course subscription

    Attended by engineers from all over the world from the premier brands

    4.8 Stars Learner Rating

    Hall Of Fame

    yCrash Certified Engineers in Performance & Troubleshooting

    Highlighting engineers certified in diagnosing and optimizing applications.

    • Kris Murray
      Kris Murray

      With over 21 years of professional experience, Kris Murray is currently employed full-time at CloudBees as a Development Support Engineer.

      Designation Development Support Engineer

      Experience 21+ yrs

      Company Cloudbees

    • Subijay Bhattacharya
      Subijay Bhattacharya

      Have 18+ years of experience in Telecom and Insurance domain and worked on Java/J2EE, Hybrid Android

      Designation Product Architect

      Experience 20+ yrs

      Company Motive

    • Brijmohan Singh
      Brijmohan Singh

      Specialties: Agile, SCRUM , Product manager, Portfolio manager, Technical Account Manager (TAM), Collection & Recoveries

      Designation Senior Manager

      Experience 16+ yrs

      Company CRsoftware

    View All

    Cool Tools

    Check Out Our Other Products

    yCrash

    yCrash

    Automatically captures & analyzes GC Logs, thread dumps, heap dumps & several more artifacts to identify root cause.

    Learn More
    HeapHero

    HeapHero

    Easy to use Java, Android heap dump analyzer. Solve OutOfMemoryError, memory leaks in seconds.

    Learn More
    FastThread

    FastThread

    Machine learning algorithms aided tool to analyze the thread dumps, core dumps, and also hs_err_pid dumps.

    Learn More
    Top Analyzer

    Top Analyzer

    Parses Unix/Linux/solaris,..etc 'top' command output & generates an intuitive report to optimize the performance.

    Learn More
    FastThread

    BuggyApp

    Simulates performance problems like Memory Leak, OutOfMemoryError, CPU spike, StackOverflowError etc.

    Learn More

    Testimonials

    What does major enterprises say about GCeasy?

    Venkat Pasupelti CTO - Mondee
    (North America's #1 leisure travel provider)

    Trinh Minh Sr. Systems Architect - Wells Fargo Bank
    (North America's #1 bank)

    Venkat Pasupelti
    CTO - Mondee (North America's #1 leisure travel provider)

    GCeasy - a true world class, enterprise grade application performance analyzer tool. In short time, GCeasy has become integral part of our performance management repertoire and it is our goto tool for application performance monitoring and for troubleshooting the memory / garbage collection problems. Your expert advise along with the metrics and diagnostics gathered from GCeasy helped us in enhancing the application performance significantly to our global clientele.

    Trinh Minh
    Sr. Systems Architect - Wells Fargo Bank (North America's #1 bank)

    GCeasy is a great time saver, what took hours of analysis from skilled engineers to triage memory issues, can now be found in mere minutes.

    FAQ

    Frequently Asked Questions. If you have further questions mail us: support@tier1app.com

    How to enable Java GC Logging?

    For Java 1.4, 5, 6, 7, 8 pass this JVM argument to your application: -XX:+PrintGCDetails -XX:+PrintGCDateStamps -Xloggc:<file-path>


    For Java 9, pass the JVM argument: -Xlog:gc*:file=<file-path>
    file-path: is the location where GC log file will be written

    GCeasy couldn't parse my GC Logs?

    We do support all of the GC log formats irrespective of the JVM version, JVM provider, GC algorithms, memory settings.


    However if we don't support your format, Please report it to support@tier1app.com. We will fix it.

    Can I look at sample GC log analysis reports?

    Sure. Here are some sample reports generated by GCeasy: